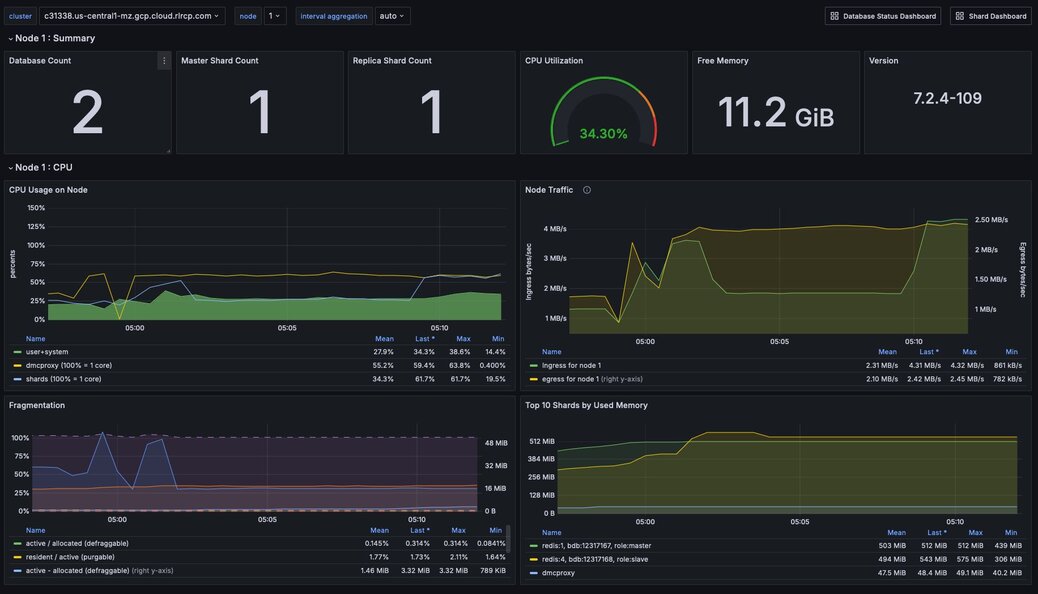
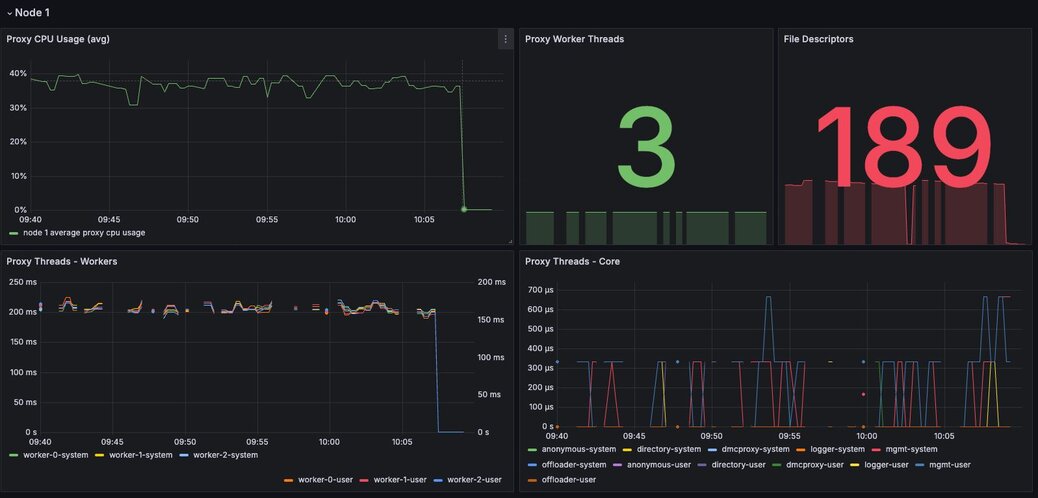
Figure 1. Dashboard showing relevant statistics for a Node
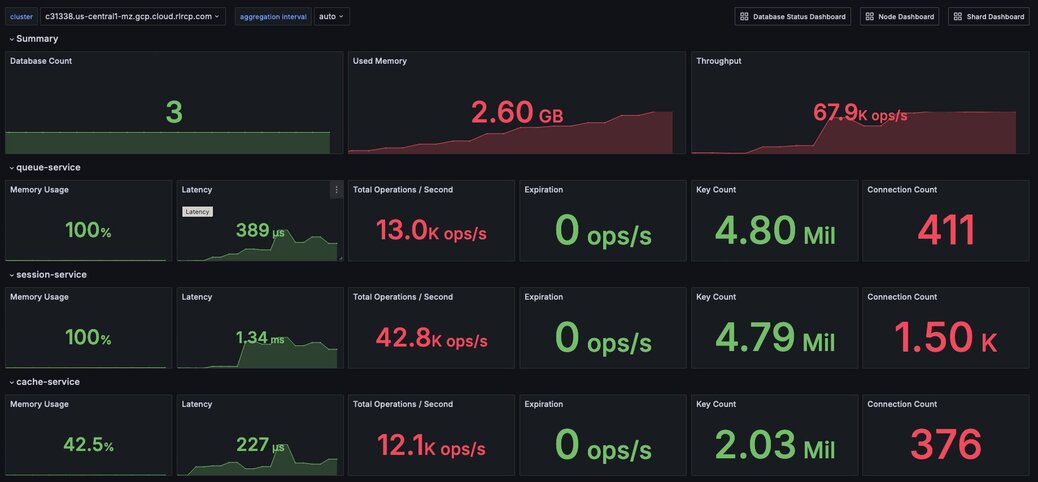
Figure 2. Dashboard showing an overview of cluster metrics
Metric name | Definition | Unit |
|---|---|---|
Memory usage percentage | Percentage of used memory relative to the configured memory limit for a given database | Percentage |
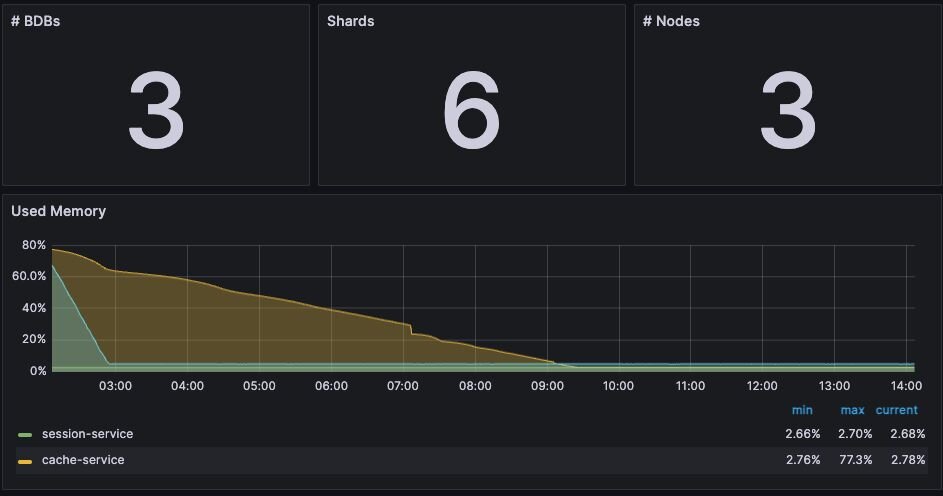
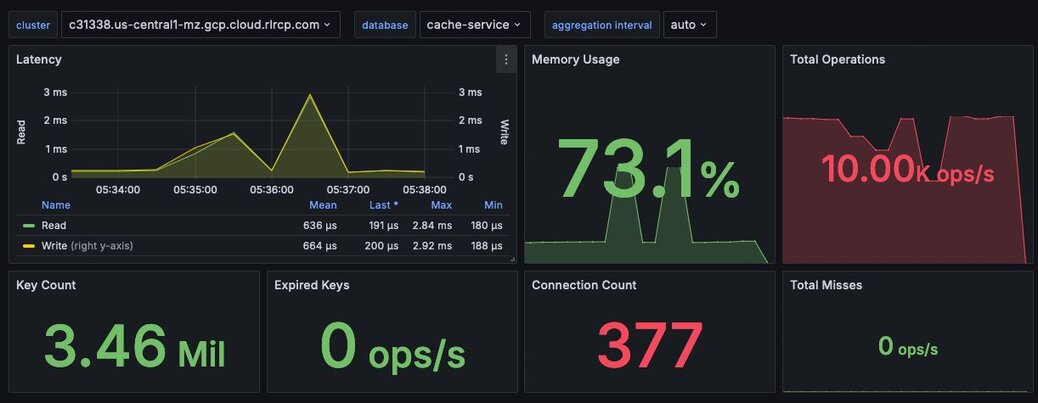
Figure 3. Dashboard displaying high-level cluster metrics - Cluster Dashboard
Name | Description |
|---|---|
noeviction | New values aren’t saved when memory limit is reached. When a database uses replication, this applies to the primary database |
allkeys-lru | Keeps most recently used keys; removes least recently used (LRU) keys |
allkeys-lfu | Keeps frequently used keys; removes least frequently used (LFU) keys |
volatile-lru | Removes least recently used keys with the expire field set to true. |
volatile-lfu | Removes least frequently used keys with the expire field set to true. |
allkeys-random | Randomly removes keys to make space for the new data added. |
volatile-random | Randomly removes keys with expire field set to true. |
volatile-ttl | Removes keys with expire field set to true and the shortest remaining time-to-live (TTL) value. |
Issue | Possible causes | Remediation |
|---|---|---|
Redis memory usage has reached 100% | This may indicate an insufficient Redis memory limit for your application’s workload | For non-caching workloads (where eviction is unacceptable), immediately increase the memory limit for the database. You can accomplish this through the Redis Software console or its API. Alternatively, you can contact Redis support to assist. For caching workloads, you need to monitor performance closely. Confirm that you have an eviction policy in place. If your application’s performance starts to degrade, you may need to increase the memory limit, as described above. |
Redis has stopped accepting writes | Memory is at 100% and no eviction policy is in place | Increase the database’s total amount of memory. If this is for a caching workload, consider enabling an eviction policy In addition, you may want to determine whether the application can set a reasonable TTL (time-to-live) on some or all of the data being written to Redis. |
Cache hit ratio is steadily decreasing | The application’s working set size may be steadily increasing. Alternatively, the application may be misconfigured (e.g., generating more than one unique cache key per cached item.) | If the working set size is increasing, consider increasing the memory limit for the database. If the application is misconfigured, review the application’s cache key generation logic. |
Metric name | Definition | Unit |
|---|---|---|
Metric Shard CPU | CPU time portion spent by database shards | Percentage, up to 100% per shard |
Metric Proxy CPU | CPU time portion spent by the cluster’s proxy(s) | Percentage, 100% per proxy thread |
Metric Node CPU (User and System) | CPU time portion spent by all user-space and kernel-level processes | Percentage, 100% per node CPU |

Figure 4. Dashboard displaying CPU usage - Database Dashboard

Figure 5. Display showing Proxy CPU usage - Proxy Dashboard
Issue | Possible causes | Remediation |
|---|---|---|
High CPU utilization across all shards of a database | This usually indicates that the database is under-provisioned in terms of number of shards. A secondary cause may be that the application is running too many inefficient Redis operations. You can detect slow Redis operations by enabling the slow log in the Redis Software UI. | First, rule out inefficient Redis operations as the cause of the high CPU utilization. See Slow operations for details on this. If inefficient Redis operations are not the cause, then increase the number of shards in the database. |
High CPU utilization on a single shard, with the remaining shards having low CPU utilization | This usually indicates a master shard with at least one hot key. Hot keys are keys that are accessed extremely frequently (e.g., more than 1000 times per second). | Hot key issues generally cannot be resolved by increasing the number of shards. To resole this issue, see Hot keys. |
High Proxy CPU | There are several possible causes of high proxy CPU. First, review the behavior of connections to the database. Frequent cycling of connections, especially with TLS is enabled, can cause high proxy CPU utilization. This is especially true when you see more than 100 connections per second per thread. Such behavior is almost always a sign of a misbehaving application. Seconds, review the total number of operations per second against the cluster. If you see more than 50k operations per second per thread, you may need to increase the number of proxy threads. | In the case of high connection cycling, review the application’s connection behavior. In the case of high operations per second, increase the number of proxy threads. |
High Node CPU | You will typically detect high shard or proxy CPU utilization before you detect high node CPU utilization. Use the remediation steps above to address high shard and proxy CPU utilization. In spite of this, if you see high node CPU utilization, you may need to increase the number of nodes in the cluster. | Consider increasing the number of nodes in the cluster and the rebalancing the shards across the new nodes. This is a complex operation and should be done with the help of Redis support. |
High System CPU | Most of the issues above will reflect user-space CPU utilization. However, if you see high system CPU utilization, this may indicate a problem at the network or storage level. | Review network bytes in and network bytes out to rule out any unexpected spikes in network traffic. You may need perform some deeper network diagnostics to identify the cause of the high system CPU utilization. For example, with high rates of packet loss, you may need to review network configurations or even the network hardware. |
Issue | Possible causes | Remediation |
|---|---|---|
Fewer connections to Redis than expected | The application may not be connecting to the correct Redis database. There may be a network partition between the application and the Redis database. | Confirm that the application can successfully connect to Redis. This may require consulting the application logs or the application’s connection configuration. |
Connection count continues to grow over time | Your application may not be releasing connections. The most common of such a connection leak is a manually implemented connection pool or a connection pool that is not properly configured. | Review the application’s connection configuration |
Erratic connection counts (e.g, spikes and drops) | Application misbehavior (thundering herds, connection cycling, ) or networking issues | Review the application logs and network traffic to determine the cause of the erratic connection counts. |

Issue | Possible causes | Remediation |
|---|---|---|
Slow database operations | Confirm that there are no excessive slow operations in the Redis slow log. | If possible, reduce the number of slow operations being sent to the database. If this not possible, consider increasing the number of shards in the database. |
Increased traffic to the database | Review the network traffic and the database operations per second chart to determine if increased traffic is causing the latency. | If the database is underprovisioned due to increased traffic, consider increasing the number of shards in the database. |
Insufficient CPU | Check to see if the CPU utilization is increasing. | Confirm that slow operations are not causing the high CPU utilization. If the high CPU utilization is due to increased load, consider adding shards to the database. |

Metric name | Definition |
|---|---|
bdb_read_hits | The number of successful read operations |
bdb_read_misses | The number of read operations returning null |
bdb_write_hits | The number of write operations against existing keys |
bdb_write_misses | The number of write operations that create new keys |

Policy | Description |
|---|---|
Single | There is only a single proxy that is bound to the database. This is the default database configuration and preferable in most use cases. |
All Master Shards | There are multiple proxies that are bound to the database, one on each node that hosts a database master shard. This mode fits most use cases that require multiple proxies. |
All Nodes | There are multiple proxies that are bound to the database, one on each node in the cluster, regardless of whether or not there is a shard from this database on the node. This mode should be used only in special cases, such as using a load balancer. |
Total cores | Redis (ROR) | Redis on Flash (ROF) |
|---|---|---|
1 | 1 | 1 |
4 | 3 | 3 |
8 | 5 | 3 |
12 | 8 | 4 |
16 | 10 | 5 |
32 | 24 | 10 |
64/96 | 32 | 20 |
128 | 32 | 32 |

Figure 14. Redis Cloud dashboard showing slow database operations
Issue | Remediation |
|---|---|
The KEYS command shows up in the slow log | Find the application that issuing the KEYS command and replace it with a SCAN command. In an emergency situation, you can alter the ACLs for the database user so that Redis will reject the KEYS command altogether. |
The slow log shows a significant number of slow, O(n) operations | If these operations are being issued against large data structures, then the application may need to be refactored to use more efficient Redis commands.command altogether. |
The slow logs contains only O(1) commands, and these commands are taking several milliseconds or more to complete | This likely indicate that the database is underprovisioned. Consider increasing the number o shards and/or nodes. |
# Alertmanager configuration
alerting:
  alertmanagers:
    - static_configs:
        - targets:
          - alertmanager:9093
# Load rules once and periodically evaluate them according to the global 'evaluation_interval'.
rule_files:
- "error_rules.yml"
- "alerts.yml"
Description | Trigger |
|---|---|
Average latency has reached a warning level | round(bdb_avg_latency * 1000) > 1 |
Average latency has reached a critical level indicating system degradation | round(bdb_avg_latency * 1000) > 4 |
Absence of any connection indicates improper configuration or firewall issue | bdb_conns < 1 |
A flood of connections has occurred that will impact normal operations | bdb_conns > 64000 |
Absence of any requests indicates improperly configured clients | bdb_total_req < 1 |
Excessive number of client requests indicates configuration and/or programmatic issues | bdb_total_req > 1000000 |
The database in question will soon be unable to accept new data | round((bdb_used_memory/bdb_memory_limit) * 100) > 98 |
The database in question will be unable to accept new data in two hours | redis_process_cpu_usage_percent{role="master"} > 0.75 and redis_process_cpu_usage_percent{role="master"} > on (bdb) group_left() (avg by (bdb)(redis_process_cpu_usage_percent{role="master"}) + on(bdb) 1.2 * stddev by (bdb) (redis_process_cpu_usage_percent{role="master"})) |
Database read operations are failing to find entries more than 50% of the time | (100 * bdb_read_hits)/(bdb_read_hits + bdb_read_misses) < 50 |
In situations where TTL values are not set this indicates a problem | bdb_evicted_objects > 1 |
Replication between nodes is not in a satisfactory state | bdb_replicaof_syncer_status > 0 |
Record synchronization between nodes is not in a satisfactory state | bdb_crdt_syncer_status > 0 |
The amount by which replication lags behind events is worrisome | bdb_replicaof_syncer_local_ingress_lag_time > 500 |
The amount by which object replication lags behind events is worrisome | bdb_crdt_syncer_local_ingress_lag_time > 500 |
The expected number of active nodes is less than expected | count(node_up) != 3 |
Persistent storage will soon be exhausted | round((node_persistent_storage_free/node_persistent_storage_avail) * 100) ⇐ 5 |
Ephemeral storage will soon be exhausted | round((node_ephemeral_storage_free/node_ephemeral_storage_avail) * 100) ⇐ 5 |
The node in question is close to running out of memory | round((node_available_memory/node_free_memory) * 100) ⇐ 15 |
The node in question has exceeded expected levels of CPU usage | round((1 - node_cpu_idle) * 100) >= 80 |
The shard in question is not reachable | redis_up == 0 |
The master shard is not reachable | floor(redis_master_link_status{role="slave"}) < 1 |
The shard in question has exceeded expected levels of CPU usage | redis_process_cpu_usage_percent >= 80 |
The master shard has exceeded expected levels of CPU usage | round((bdb_used_memory/bdb_memory_limit) * 100) < 98 and (predict_linear(bdb_used_memory[15m], 2 * 3600) / bdb_memory_limit) > 0.3 and round(predict_linear(bdb_used_memory[15m], 2 * 3600)/bdb_memory_limit) > 0.98 |
The shard in question has an unhealthily high level of connections | redis_connected_clients > 500 |
This tutorial provides monitoring guidance for developers running applications that connect to Redis Software. In particular, this guide focuses on the systems and resources that are most likely to impact the performance of your application.
To effectively monitor a Redis Enterprise cluster you need to observe core cluster resources and key database performance indicators.
Core cluster resources include:
Key database performance indicators include:
In addition to manually monitoring these resources and indicators, we recommend setting up alerts.
Every Redis Software database has a maximum configured memory limit to ensure isolation in a multi-database cluster.
The appropriate memory threshold depends on how the application is using Redis.
For applications using Redis solely as a cache, you can safely let the memory usage reach 100% as long as you have an eviction policy in place. This will ensure that Redis can evict keys while continuing to accept new writes.
NB Eviction will increase write command latency as Redis has to cleanup the memory/objects before accepting a new write to prevent OOM when memory usage is at 100%
While your Redis database is using 100% of available memory in a caching context, it’s still important to monitor performance. The key performance indicators include:
Latency has two important definitions, depending on context:
You need to monitor both application-level and Redis-level latency to diagnose caching performance issues in production.
Cache hit ratio is the percentage of read requests that Redis serves successfully. Eviction rate is the rate at which Redis evicts keys from the cache. These metrics are often inversely correlated: a high eviction rate may cause a low cache hit ratio.
If the Redis server is empty, the hit ratio will be 0%. As the application runs and the fills the cache, the hit ratio will increase.
When the entire cached working set fits in memory, then the cache hit ratio will reach close to 100% while the percent of used memory will remain below 100%.
When the working set cannot fit in memory, the eviction policy will start to evict keys. The greater the rate of key eviction, the lower the cache hit ratio.
In both cases, keys will may be manually invalidated by the application or evicted through the uses of TTLs (time-to-live) and an eviction policy.
The ideal cache hit ratio depends on the application, but generally, the ratio should be greater than 50%. Low hit ratios coupled with high numbers of object evictions may indicate that your cache is too small. This can cause thrashing on the application side, a scenario where the cache is constantly being invalidated.
The upshot here is that when your Redis database is using 100% of available memory, you need to measure the rate of key evictions.
An acceptable rate of key evictions depends on the total number of keys in the database and the measure of application-level latency. If application latency is high, check to see that key evictions have not increased.
The volatile-lru and volatile-random policies are mainly useful when you want to use a single instance for both caching and to have a set of persistent keys. However it is usually a better idea to run two Redis instances to solve such a problem.
NB Setting an expire value to a key costs memory, so using a policy like allkeys-lru is more memory efficient since there is no need for an expire configuration for the key to be evicted under memory pressure.
If no eviction policy is enabled, then Redis will stop accepting writes once memory reaches 100%. Therefore, for non-caching workloads, we recommend that you configure an alert at 80% memory usage. Once your database reaches this 80% threshold, you should closely review the rate of memory usage growth.
Redis Software provides several CPU metrics:
To understand CPU metrics, it’s worth recalling how a Redis Software cluster is organized. A cluster consists of one or more nodes. Each node is a VM (or cloud compute instance) or a bare-metal server.
A database is a set of processes, known as shards, deployed across the nodes of a cluster.
In the dashboard, shard CPU is the CPU utilization of the processes that make up the database. When diagnosing performance issues, start by looking at shard CPU.
In general, we define high CPU as any CPU utilization above 80% of total capacity.
Shard CPU should remain below 80%. Shards are single-threaded, so a shard CPU of 100% means that the shard is fully utilized.
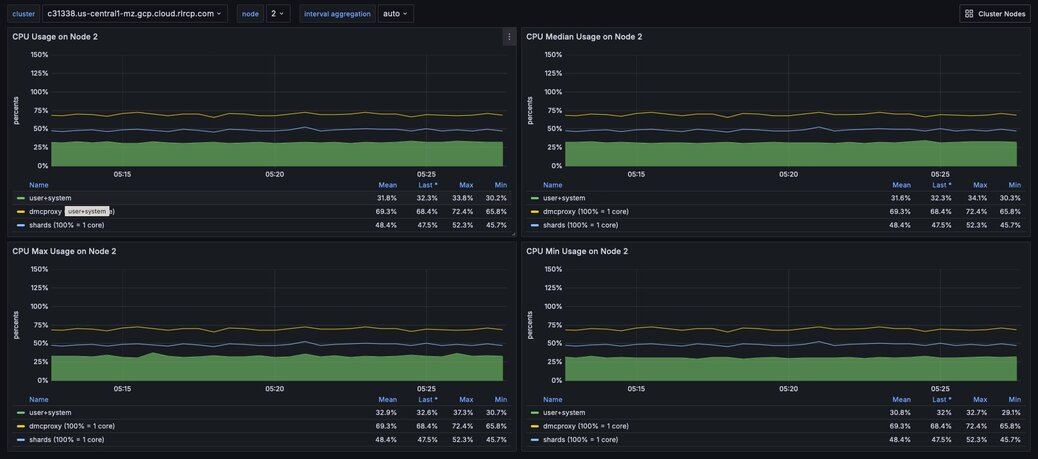
Proxy CPU should remain below 80% of total capacity. The proxy is a multi-threaded process that handles client connections and forwards requests to the appropriate shard. Because the total number of proxy threads is configurable, the proxy CPU may exceed 100%. A proxy configured with 6 threads can reach 600% CPU utilization, so in this case, keeping utilization below 80% means keeping the total proxy CPU usage below 480%.
Figure 6. Dashboard displaying an ensemble of Node CPU usage data - Node Dashboard
Node CPU should also remain below 80% of total capacity. As with the proxy, the node CPU is variable depending on the CPU capacity of the node. You will need to calibrate your alerting based on the number of cores in your nodes.
The Redis Software database dashboard indicates to the total number of connections to the database.
This connection count metric should be monitored with both a minimum and maximum number of connections in mind. Based on the number of application instances connecting to Redis (and whether your application uses connection pooling), you should have a rough idea of the minimum and maximum number of connections you expect to see for any given database. This number should remain relatively constant over time.
Figure 7. Dashboard displaying connections - Database Dashboard
The network ingress / egress panel show the amount of data being sent to and received from the database. Large spikes in network traffic can indicate that the cluster is under-provisioned or that the application is reading and/or writing unusually large keys. A correlation between high network traffic and high CPU utilization may indicate a large key scenario.
One possible cause is that the database endpoint is not located on the same node as master shards. In addition to added network latency, if data plane internode encryption is enabled, CPU consumption can increase as well.
One solution is to used the optimal shard placement and proxy policy to ensure endpoints are collocated on nodes hosting master shards. If you need to restore balance (e.g. after node failure) you can manually failover shard(s) with the rladmin cli tool.
Extreme network traffic utilization may approach the limits of the underlying network infrastructure. In this case, the only remediation is to add additional nodes to the cluster and scale the database’s shards across them.
In Redis Software, geographically-distributed synchronization is based on CRDT technology. The Redis Enterprise implementation of CRDT is called an Active-Active database (formerly known as CRDB). With Active-Active databases, applications can read and write to the same data set from different geographical locations seamlessly and with low latency, without changing the way the application connects to the database.
An Active-Active architecture is a data resiliency architecture that distributes the database information over multiple data centers via independent and geographically distributed clusters and nodes. It is a network of separate processing nodes, each having access to a common replicated database such that all nodes can participate in a common application ensuring local low latency with each region being able to run in isolation.
To achieve consistency between participating clusters, Redis Active-Active synchronization uses a process called the syncer.
The syncer keeps a replication backlog, which stores changes to the dataset that the syncer sends to other participating clusters. The syncer uses partial syncs to keep replicas up to date with changes, or a full sync in the event a replica or primary is lost.
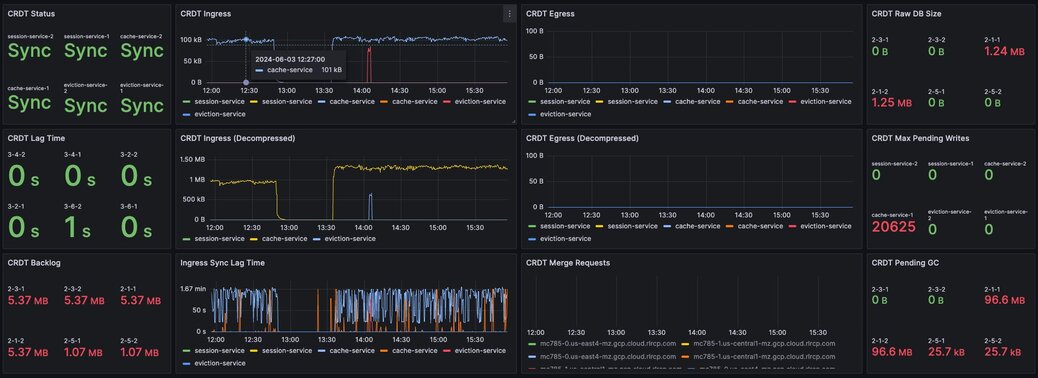
Figure 8. Dashboard displaying connection metrics between zones - Synchronization Dashboard
CRDT provides three fundamental benefits over other geo-distributed solutions:
There several key performance indicators that report your database’s performance against your application’s workload:
Latency is the time it takes for Redis to respond to a request. Redis Software measures latency from the first byte received by the proxy to the last byte sent in the command’s response.
An adequately provisioned Redis database running efficient Redis operations will report an average latency below 1 millisecond. In fact, it’s common to measure latency in terms is microseconds. Customers regularly achieve, and sometime require, average latencies of 400-600 microseconds.
Figure 9. Dashboard display of latency metrics - Database Dashboard
The metrics distinguish between read and write latency. Understanding whether high latency is due to read or writes can help you to isolate the underlying issue.
Note that these latency metrics do not include network round trip time or application-level serialization, which is why it’s essential to measure request latency at the application, as well.
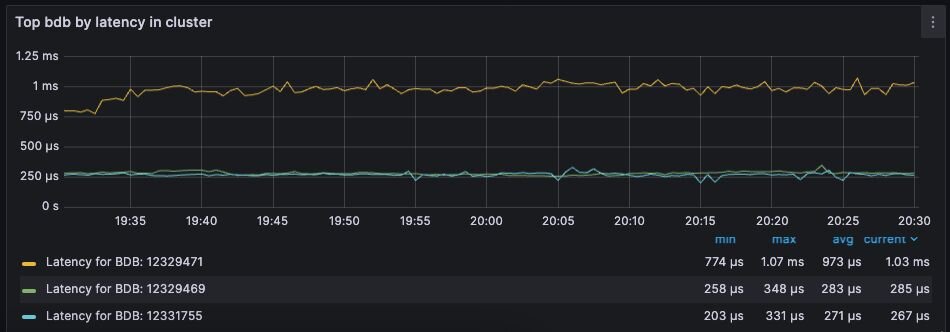
Figure 10. Display showing a noticeable spike in latency
Here are some possible causes of high database latency. Note that high database latency is just one possible cause of high application latency. Application latency can be caused by a variety of factors, including a low cache hit rate, a high rate of evictions, or a networking issue.
Cache hit rate is the percentage of all read operations that return a response. Cache hit rate is a composite statistic that is computed by dividing the number of read hits by the total number of read operations. When an application tries to read a key that exists, this is known as a cache hit. Alternatively, when an application tries to read a key that does not exist, this is knows as a cache miss.
For caching workloads, the cache hit rate should generally be above 50%, although the exact ideal cache hit rate can vary greatly depending on the application and depending on whether the cache is already populated.
Figure 11. Dashboard showing the cache hit ratio along with read/write misses - Database Dashboard
Note: Redis Enterprise actually reports four different cache hit / miss metrics. These are defined as follows:
Cache hit rate is usually only relevant for caching workloads. See Cache hit ratio and eviction for tips on troubleshooting cache hit rate.
They key eviction rate is rate at which objects are being evicted from the database. If an eviction policy is in place for a database, eviction will begin once the database approaches its max memory capacity.
A high or increasing rate of evictions will negatively affect database latency, especially if the rate of necessary key evictions exceeds the rate of new key insertions.
See Cache hit ratio and eviction for a discussion if key eviction and its relationship with memory usage.
Figure 12. Dashboard displaying object evictions - Database Dashboard
Redis Software (RS) provides high-performance data access through a proxy process that manages and optimizes access to shards within the RS cluster. Each node contains a single proxy process. Each proxy can be active and take incoming traffic or it can be passive and wait for failovers.
Figure 13. Dashboard displaying proxy thread activity - Proxy Thread Dashboard
When needed, we can tune the number of proxy threads using the "rladmin tune proxy" command in order to be able to make the proxy use more CPU cores. Nevertheless, cores used by the proxy won’t be available for Redis, therefore we need to take into account the number of Redis nodes on the host and the total number of available cores.
How to set a new number of proxy cores using the command:
The following table indicates ideal proxy thread counts for the specified environments.
There are three data access patterns that can limit the performance of your Redis database:
This section defines each of these patterns and describes how to diagnose and mitigate them.
Slow operations are operations that take longer than a few milliseconds to complete.
Not all Redis operations are equally efficient. The most efficient Redis operations are O(1) operations; that is, they have a constant time complexity. Example of such operations include GET, SET, SADD, and HSET.
These constant time operations are unlikely to cause high CPU utilization. Even so, it’s still possible for a high rate of constant time operations to overwhelm an underprovisioned database.
Other Redis operations exhibit greater levels of time complexity. O(n) (linear time) operations are more likely to cause high CPU utilization. Examples include HGETALL, SMEMBERS, and LREM. These operations are not necessarily problematic, but they can be if executed against data structures holding a large number of elements (e.g., a list with 1 million elements).
That said, the KEYS command should almost never be run against a production system, since returning a list of all keys in a large Redis database can cause significant slowdowns and block other operations. If you need to scan the keyspace, especially in a production cluster, always use the SCAN command instead.
The best way to discover slow operations is to view the slow log. The slow low is available in the Redis Software and Redis Cloud consoles: * Redis Software slow log docs * Redis cloud slow log docs
A hot key is a key that is accessed extremely frequently (e.g., thousands of time a second or more).
Each key in Redis belongs to one, and only one, shard. For this reason, a hot key can cause high CPU utilization on that one shard, which can increase latency for all other operations.
You may suspect that you have a hot key if you see high CPU utilization on a single shard. There are two main way to identify hot keys: using the Redis CLI and sampling the operations against Redis.
To use the Redis CLI to identify hot keys:
redis-cli --hotkeysYou may also identify hot keys by sampling the operations against Redis. You can use do this by running the MONITOR command against the high CPU shard. Since this a potentially high-impact operation, you should only use this technique as a secondary resort. For mission-critical databases, consider contact Redis support for assistance.
Once you discover a hot key, you need to find a way to reduce the number of operations against it. This means getting an understanding of the application’s access pattern and the reasons for such frequently access.
If the hot key operations are read-only, then consider implementing an application-local cache so that fewer read request are sent to Redis. For example, even a local cache that expires every 5 seconds can entirely eliminate a hot key issue.
Large keys are keys that are hundreds of kilobytes or larger. High network traffic and high CPU utilization can be caused by large keys.
To identify large keys, you can sample the keyspace using the Redis CLI.
Run redis-cli --memkeys against your database to sample the keyspace in real time and potentially identify the largest keys in your database.
Addressing a large key issues requires understanding why the application is creating large keys in the first place. As such, it’s difficult to provide general advice to solving this issue. Resolution often requires a change to the application’s data model or the way it interacts with Redis.
The Redis Software observability package includes a suite of alerts and their associated tests for use with Prometheus. Not all the alerts are appropriate for all environments; for example, installations that do not use persistence have no need for storage alerts.
The alerts are packaged with a series of test that validate the individual triggers. You can use these test to validate your modification to these alerts for specific environments and use cases.
To use these alerts, install Prometheus Alertmanager. For a comprehensive guide to alerting with Prometheus and Grafana, see the Grafana blog post on the subject.
To configure Prometheus for alerting, open the prometheus.yml configuration file.
Uncomment the Alertmanager section of the file. The following configuration starts Alertmanager and instructs it to listen on its default port of 9093.
The Rule file section of the config file instructs Alertmanager to read specific rules files. If you pasted the 'alerts.yml' file into '/etc/prometheus' then the following configuration would be required.
Once this is done, restart Prometheus.
The built-in configuration, error_rules.yml, has a single alert: Critical Connection Exception. If you open the Prometheus console, by default located at port 9090, and select the Alert tab, you will see this alert, as well as the alerts in any other file you have included as a rules file.
The following is a list of alerts contained in the alerts.yml file. There are several points consider:
Grafana dashboards are available for Redis Software and Redis Cloud deployments.
These dashboards come in three styles, which may be used in concert with one another to provide a holistic picture of your deployment.
There are two additional sets of dashboards for Redis Software that provide drill-down functionality: the workflow dashboards.